Los Angeles
Los Angeles, United States, scores 74 on the CIRA Index of tourism resilience, #23 of 309 destinations. 28 of 29 measures come from public sources, with 81% confidence. Every grade below states its value, period and source.
Scores by each organisation's criteria
- CIRA Index: 74
- OECD: 73
- UN Tourism: 73
- UNDRR: 64
Strongest
- Tropical nights: 8.2 nights a year with a minimum at or above 20°C (last 5 full years) (ERA5 reanalysis via Open-Meteo, 2021–2025). At or below 10: grade 4/4.
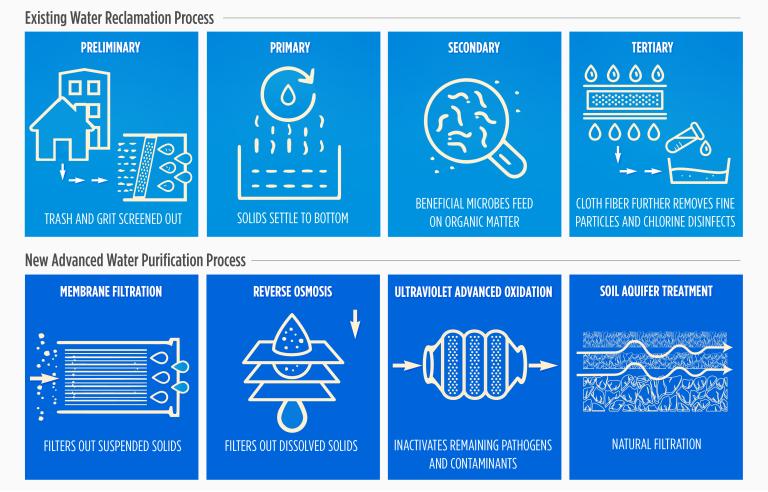
- Wastewater safely treated: 100 % of domestic wastewater safely treated (LADWP / LA Sanitation & Environment (LASAN), 2024). At or above 95: grade 4/4.
- Rent growth: -1.1 % change in rents over the last 12 months (Apartment List, Los Angeles Rent Report, September 2025–September 2026). At or below 3: grade 4/4.
Weakest
- Municipal waste per resident: 1,027 kg per resident per year (country figure) (California Department of Resources Recycling and Recovery (CalRecycle), State of Disposal and Recycling in California 2024, 2024). Above 700: grade 0/4.
- Wildfire and storm hazard: high (region figure) (World Bank GFDRR ThinkHazard, current (retrieved 2026)). Grade 1/4.
- Flood hazard: high (region figure) (World Bank GFDRR ThinkHazard, current (retrieved 2026)). Grade 1/4.
United States in the World Economic Forum Travel & Tourism Development Index
United States is #2 of 110 countries (5.23 of 7) in the WEF Travel & Tourism Development Index 2026, which scores countries, not cities. Cities in countries with that WEF score average 70 on the CIRA Index; Los Angeles is 4 above that.
Every measure, by theme
Demand and seasonality: 79
- Nights in the three busiest months: 28.4 % of annual nights (country figure) (World Economic Forum, TTDI 2026 (data: UN Tourism by United Nations World Tourism Organization), 2024, 2025 moving average). At or below 30: grade 4/4. Source
- Domestic share of nights: 87.1 % of nights by residents of the same country (region figure) (Los Angeles Tourism & Convention Board and Tourism Economics, 2025). At or above 45: grade 4/4. Source
- Largest foreign market: 29.5 % of international arrivals or nights (region figure) (Los Angeles Tourism & Convention Board / Road Genius, 2023). Between 20 and 30: grade 2/4. Source
- Recovery against 2019: 97 % of 2019 visitor nights reached in the latest full year (Los Angeles Tourism & Convention Board / Tourism Economics, 2023). Between 90 and 100: grade 2/4. Source
- Average length of stay: 3.6 nights per visitor (Los Angeles Tourism & Convention Board (LATCB), Marketing and Planning Resource, 2018). At or above 3.5: grade 4/4. Source
- Hotel bed or room occupancy: 71.7 % average annual occupancy (Los Angeles Tourism & Convention Board / Tourism Economics, 2023). Between 65 and 75: grade 3/4. Source
Economy and jobs: 94
- Jobs in tourism industries: 6.3 % of employment in accommodation and food services (country figure) (World Economic Forum, TTDI 2026 (data: Travel & Tourism Economic Impact Research by World Travel & Tourism Council; Travel & Tourism by World Travel & Tourism Council), 2026). At or below 8: grade 4/4. Source
- Unemployment rate: 5 % of the labour force (metro figure) (California Employment Development Department (EDD) / U.S. Bureau of Labor Statistics, August 2026). At or below 5: grade 4/4. Source
- Income per head: 92,647 GDP per capita, USD PPP (metro figure) (U.S. Bureau of Economic Analysis (BEA), 2024). At or above 60,000: grade 4/4. Source
- Economic diversity: 77.4 % of employment outside accommodation, food, retail and transport (metro figure) (California Employment Development Department (EDD), Labor Market Information Division, August 2026). Between 72 and 80: grade 3/4. Source
Climate and hazards: 60
- Extreme heat days: 13.8 days a year at or above 35°C (last 5 full years) (ERA5 reanalysis via Open-Meteo, 2021–2025). Between 5 and 15: grade 3/4. Source
- Tropical nights: 8.2 nights a year with a minimum at or above 20°C (last 5 full years) (ERA5 reanalysis via Open-Meteo, 2021–2025). At or below 10: grade 4/4. Source
- Flood hazard: high (region figure) (World Bank GFDRR ThinkHazard, current (retrieved 2026)). Grade 1/4. Source
- Wildfire and storm hazard: high (region figure) (World Bank GFDRR ThinkHazard, current (retrieved 2026)). Grade 1/4. Source
- Country disaster risk: 3.3 INFORM Risk index, 0–10 (country figure) (INFORM Risk (European Commission JRC), INFORM Risk Mid 2026, 2026). Between 2 and 3.5: grade 3/4. Source
Water and environment: 56
- Water scarcity: low (region figure) (World Bank GFDRR ThinkHazard, current (retrieved 2026)). Grade 3/4. Source
- Wastewater safely treated: 100 % of domestic wastewater safely treated (LADWP / LA Sanitation & Environment (LASAN), 2024). At or above 95: grade 4/4. Source
- Municipal waste per resident: 1,027 kg per resident per year (country figure) (California Department of Resources Recycling and Recovery (CalRecycle), State of Disposal and Recycling in California 2024, 2024). Above 700: grade 0/4. Source
- Green space: 24.9 % of the urban area that is green or tree-covered (USDA Forest Service / TreePeople & Loyola Marymount University CURes assessment, 2020). Between 20 and 30: grade 2/4. Source


Community and housing: 67
- Tourism intensity: not measured yet
- Cruise pressure: not measured yet
- Rent growth: -1.1 % change in rents over the last 12 months (Apartment List, Los Angeles Rent Report, September 2025–September 2026). At or below 3: grade 4/4. Source
- Short-let density: 2 short-term rental listings per 100 dwellings (AirDNA & U.S. Census Bureau ACS, August 2026). Between 2 and 4: grade 1/4. Source
- Resident support for tourism: 64 % of residents who say tourism benefits them or the city (country figure) (Destinations International & Longwoods International, United States Industry Brief: 2024 National Resident Sentiment, 2024). Between 60 and 70: grade 3/4. Source
Access and continuity: 83
- Access redundancy: 4 independent ways in: international airport, intercity rail, port, motorway (Port of Los Angeles, Los Angeles World Airports, Amtrak, Caltrans, 2024). At or above 4: grade 4/4. Source
- Air traffic recovery: not measured yet
- Rail share of intercity access: not measured yet
- Rail traffic recovery: not measured yet
- Largest airline group share: not measured yet
- Air route concentration: not measured yet
- Early warning and emergency plan: An updated city plan with public early warning for heat, flood or fire (City of Los Angeles Emergency Management Department, 2024–2026). Grade 3/4. Source
- Tourism crisis and recovery plan: Crisis communication only, ad hoc (City of Los Angeles Tourism Department, Tourism Master Plan, 2022–2025). Grade 1/4. Source
- Government effectiveness: 84 World Bank WGI percentile rank, 0–100 (country figure) (World Bank Worldwide Governance Indicators, 2025). At or above 80: grade 4/4. Source
- Travel advisory: 1 stricter of the US and Canadian government advisory for the country, 1 (normal precautions) to 4 (do not travel) (country figure) (US State Department and Government of Canada travel advisories, 2026-09-29). At or below 1: grade 4/4. Source
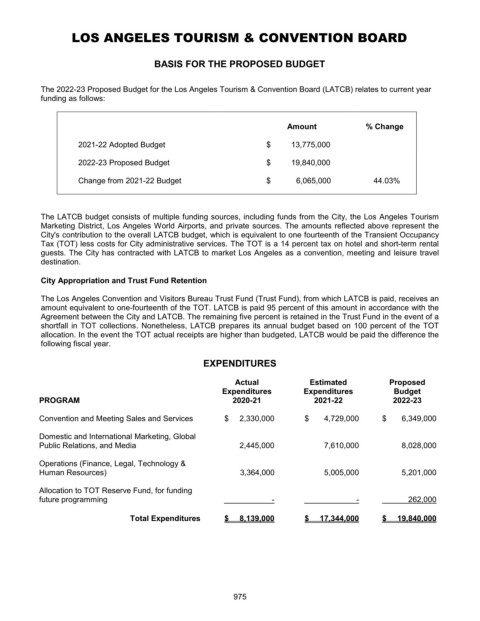
- Dedicated tourism funding: A dedicated source plus a reserve or stabilisation fund for downturns (City Administrative Officer, City of Los Angeles, Proposed Budget Blue Book, 2022–2024). Grade 4/4. Source
Compare Los Angeles
- Los Angeles vs New York
- Los Angeles vs San Francisco
- Las Vegas vs Los Angeles
- Los Angeles vs Miami
- Boston vs Los Angeles
- Los Angeles vs Seattle
- Los Angeles vs New Orleans
- Los Angeles vs Montreal
- Los Angeles vs Ottawa
The CIRA Index ranking · City vs city · How the index works · CIRA Studio · Put your city in the pilot